What it actually looks like
Real pages from a real edition, not concept art.
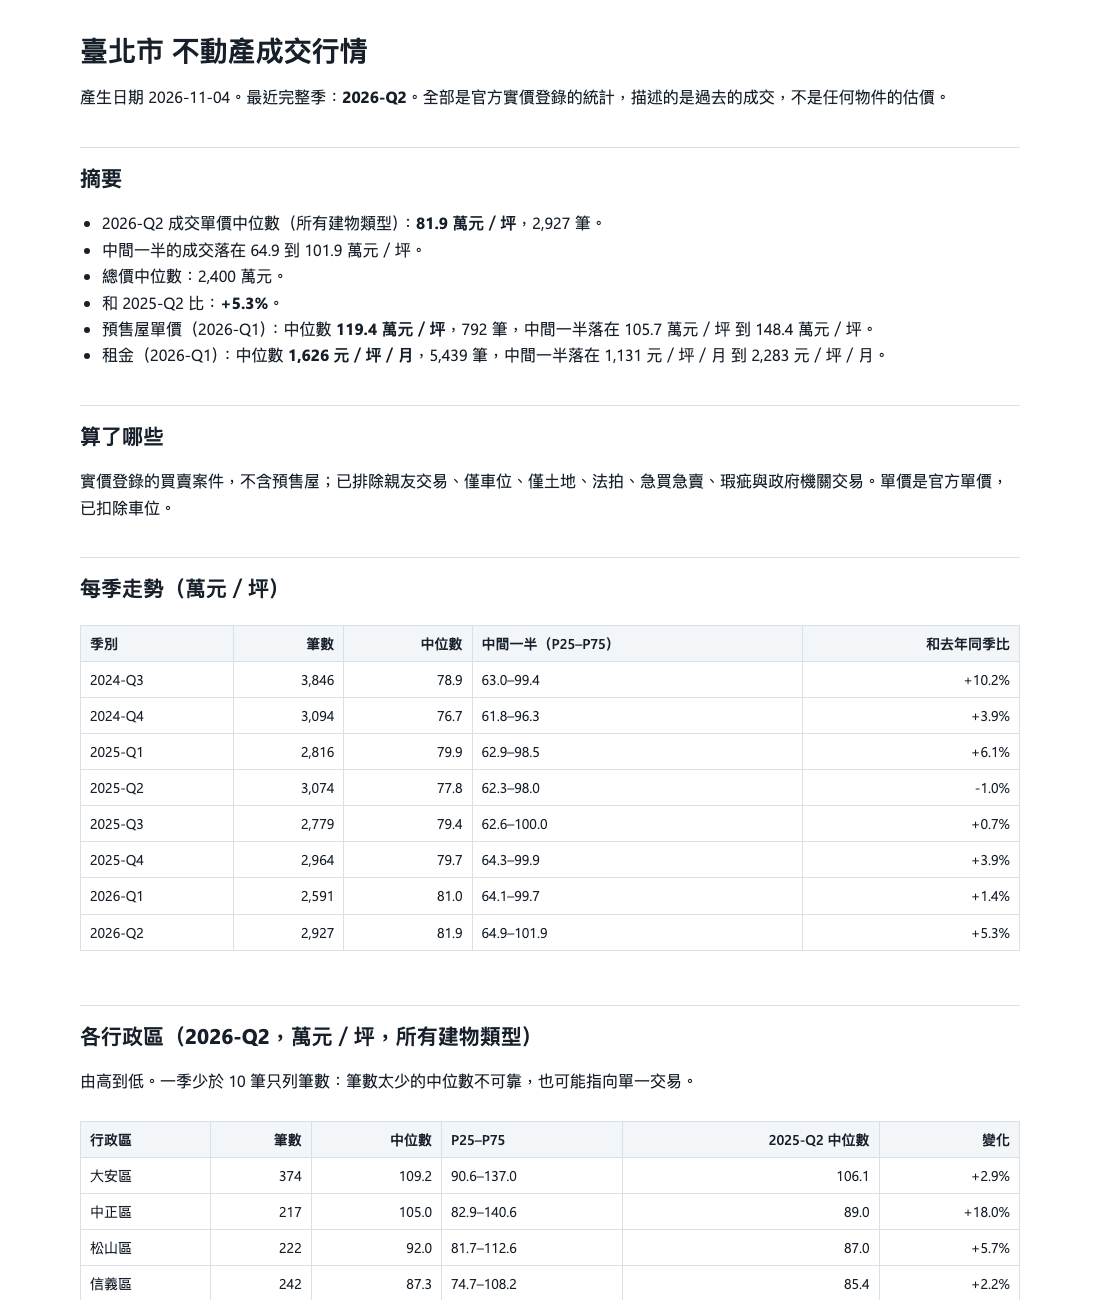
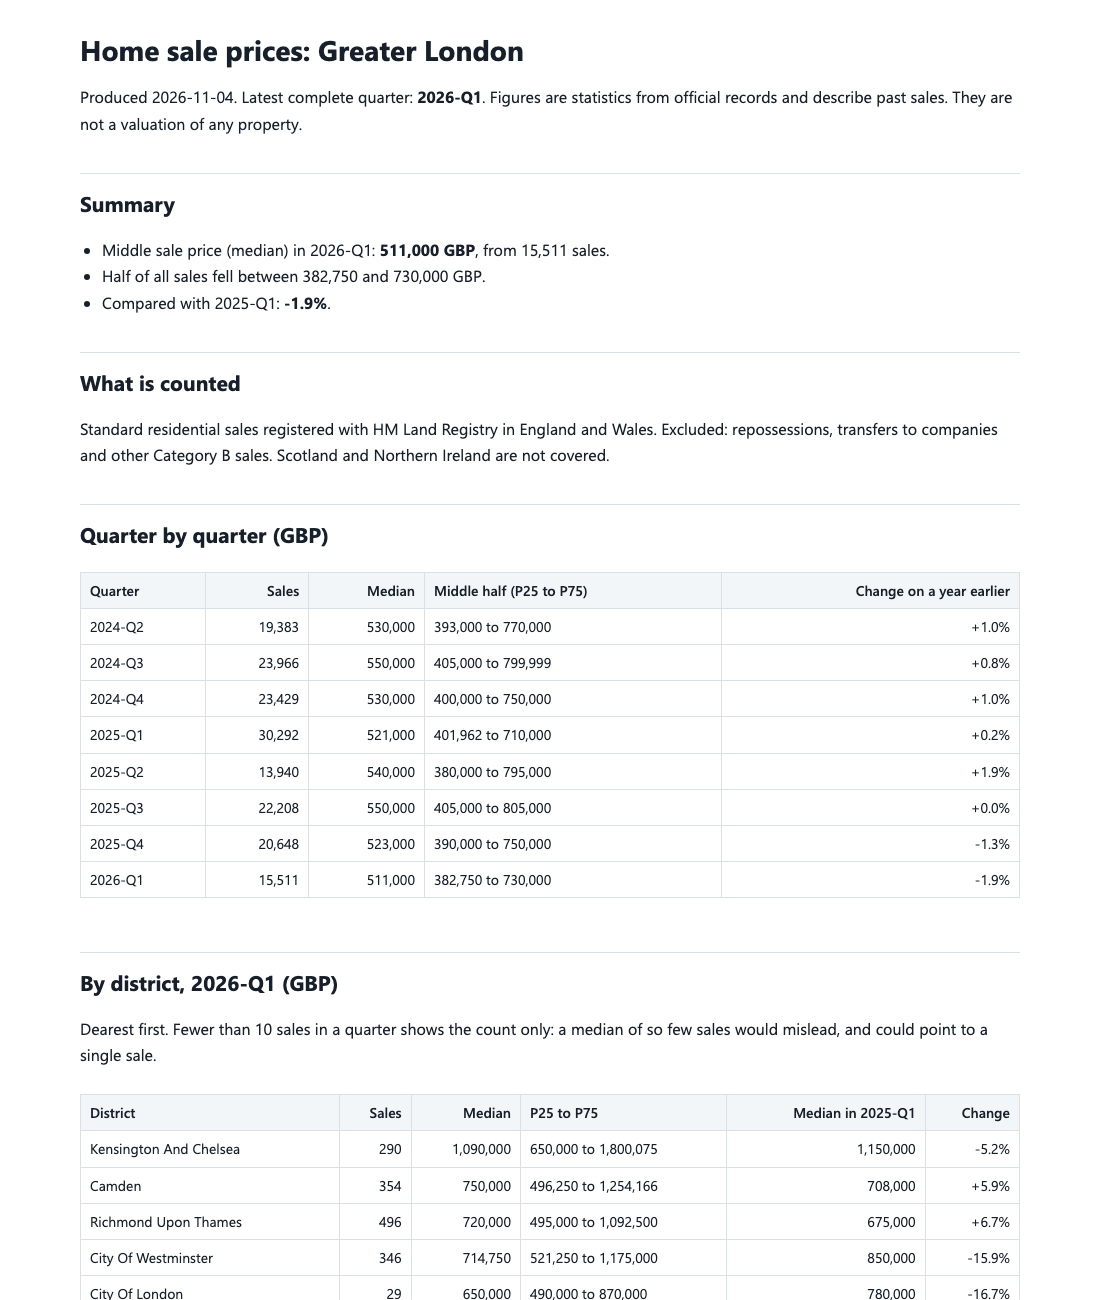
Pick an area in Taiwan, the UK, France or Singapore and get recorded sale prices: median, quartiles, year on year, by district and type.
Data as of 2026-11-04
| Area | District | Type | Median |
|---|---|---|---|
| Singapore | Ang Mo Kio | 2-room | 6,886 SGD/m² |
| Singapore | Ang Mo Kio | 3-room | 5,970 SGD/m² |
| Singapore | Ang Mo Kio | 4-room | 6,463 SGD/m² |
| Singapore | Ang Mo Kio | 5-room | 8,818 SGD/m² |
| Singapore | Ang Mo Kio | All property types | 6,167 SGD/m² |
| Singapore | Bedok | 3-room | 5,970 SGD/m² |
Real pages from a real edition, not concept art.
A county, UK county, French department or Singapore.
No subscription.
Open it in a browser and print it to PDF.
Only recorded sale prices from official registers.
Ranked districts and property types for your area.
Cells with too few sales show a count, not a misleading median.
A report you can print to PDF.
Column names and example values from the latest real edition.
| Field | Example |
|---|---|
country | France |
area | Ain (01) |
district | Ambronay |
property_type | Maison |
quarter | 2025-Q3 |
sales | 10 |
median | 1751 |
p25 | 1390 |
p75 | 2161 |
unit | EUR/m² |
median_total_price | 198000 |
currency | EUR |
Check an asking price against what really sold nearby.
Compare districts before going further.
Get area numbers without cleaning the raw files.
Join now and your price stays the same for as long as you stay subscribed.
One-off, founding price.
Opens soonThis is a direction, not a promise, and there are no dates.
Some registers publish summaries free, such as the UK's. We save you assembling and ranking it, and you can check them first.
You pick it at checkout, and the report arrives by email.
If we can't make a report for your area, you get your money back.